The January FOMC meeting played out largely as-expected with the target range unchanged but the Reverse Repo Rate (RRP) & Interest on Excess Reserves (IOER) adjusted higher by +5bps. Market reaction saw yields slide further across the curve as Powell sounded rather dovish, emphasizing downside risks to growth including uncertainty around the virus. The front-end in particular traded well, accelerating higher during the press conference, closing near session highs with 2s trading 1.415 (~18/19bps through where the Effective Fed Funds Rate (EFFR) should trade on Thursday).
At face value, the market is now pricing in around 7bp more of additional cuts (see table below) by year end than it was before the January meeting yesterday. A full 25bp cut is now priced in by September 2020 whereas before the January meet it was not fully priced in until December. A total of 39bp of cuts are priced in by year end. However, this all assumes the EFFR stays unchanged at current levels but we would actually expect it to drift higher over the next few sessions after the IOER adjustment yesterday, meaning the table is likely underestimating the level of cuts priced in. Assuming the EFFR readjusts higher by the full 5bp of the IOER adjustment, it will mean we are now pricing in ~44bp of cuts by year end.
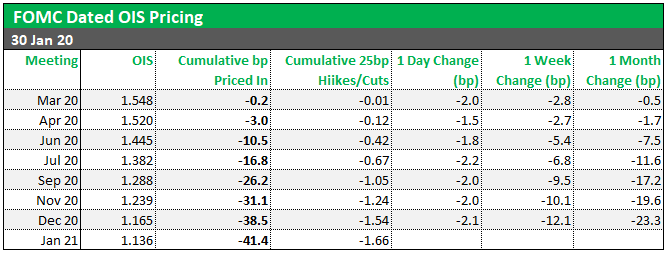
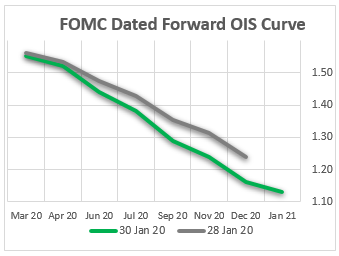
The table and graphs show what the financial markets anticipate (or are “pricing in”) for future interest rate policy from the Federal Reserve’s FOMC – ie Fed Funds hikes and/or cuts - and how this has changed over recent days and weeks. This provides a great barometer of how the markets are interpreting the impact of recent news, speeches, data and events on the outlook for monetary policy.
To create the table we analyse the OIS markets (see details below). The table shows, for each future FOMC meeting: the level of the OIS market, how much that implies the FOMC rate will move up or down from current levels by the time of that meeting (in basis points) and how many hikes or cuts that is equivalent to. The table also details how much these expectations have changed over the last day, week and month.
If, for example, the table shows the FOMC will lower rates 12.5bp by the December meeting (ie half a 25bp cut), this implies the market thinks there is a 50% chance of an interest rate cut at, or before, the December meeting.
Interpreting the Data
There are a few different ways to determine what the market expects for future interest rates moves by central banks. All involve analysing short term interest rate markets and the options vary a little by country. We generally prefer using the OIS (overnight indexed swap) market - specifically the OIS swap dated to a specific central bank meeting. The dates on these swap contracts exactly match the central bank policy implementation dates allowing for an accurate reading. The difference between the interest rates implied by these OIS contracts and the actual current overnight interest rate can be interpreted as the expectations for the direction and magnitude for that central bank’s future interest rate policy change. For the FOMC we use FOMC Dated OIS contracts.
At face value, the market is now pricing in around 7bp more of additional cuts (see table below) by year end than it was before the January meeting yesterday. A full 25bp cut is now priced in by September 2020 whereas before the January meet it was not fully priced in until December. A total of 39bp of cuts are priced in by year end. However, this all assumes the EFFR stays unchanged at current levels but we would actually expect it to drift higher over the next few sessions after the IOER adjustment yesterday, meaning the table is likely underestimating the level of cuts priced in. Assuming the EFFR readjusts higher by the full 5bp of the IOER adjustment, it will mean we are now pricing in ~44bp of cuts by year end.
The table and graphs show what the financial markets anticipate (or are “pricing in”) for future interest rate policy from the Federal Reserve’s FOMC – ie Fed Funds hikes and/or cuts - and how this has changed over recent days and weeks. This provides a great barometer of how the markets are interpreting the impact of recent news, speeches, data and events on the outlook for monetary policy.
To create the table we analyse the OIS markets (see details below). The table shows, for each future FOMC meeting: the level of the OIS market, how much that implies the FOMC rate will move up or down from current levels by the time of that meeting (in basis points) and how many hikes or cuts that is equivalent to. The table also details how much these expectations have changed over the last day, week and month.
If, for example, the table shows the FOMC will lower rates 12.5bp by the December meeting (ie half a 25bp cut), this implies the market thinks there is a 50% chance of an interest rate cut at, or before, the December meeting.
Interpreting the Data
There are a few different ways to determine what the market expects for future interest rates moves by central banks. All involve analysing short term interest rate markets and the options vary a little by country. We generally prefer using the OIS (overnight indexed swap) market - specifically the OIS swap dated to a specific central bank meeting. The dates on these swap contracts exactly match the central bank policy implementation dates allowing for an accurate reading. The difference between the interest rates implied by these OIS contracts and the actual current overnight interest rate can be interpreted as the expectations for the direction and magnitude for that central bank’s future interest rate policy change. For the FOMC we use FOMC Dated OIS contracts.